
The Incredible Growth of Web Usage [1984-2013]
Disclosure: Your support helps keep the site running! We earn a referral fee for some of the services we recommend on this page. Learn more
![The Incredible Growth of Web Usage [1984-2013]](https://cybernewsguide.com/files/wp-content/uploads/2013/08/explosion-of-web-use.jpg "The Incredible Growth of Web Usage [1984-2013]")
In the three decades since the Internet evolved from an experimental band of academic and government computers into a globe-spanning network of interconnected systems, the amount of time spent online has grown to rival (or even exceed) the time spent living offline. We rely on the Internet to host our websites, provide entertainment, and even manage our social obligations. Personal computers, tablets and smartphones have made the connected life a reality, and the number of folks pursuing it has exploded.
This explosion is due in no small part to the extended application of an axiom known as Moore’s Law. While ostensibly a prediction about semi-conductor innovation rates, this bit of prophecy from Intel co-founder Gordon Moore has come to represent the doubling not just of processing power, but of computing power in general. Moore’s Law has become a battle cry for the tech industry, where today’s cutting edge is already too dull for tomorrow’s mustard.
As more and more things become possible on the Internet—socializing, grocery shopping, even cornering the real estate market—there comes an immediate call to make doing so the standard. In the mid 1980s, you might spend all afternoon visiting your friends before dropping by the bank and grocery, and then go out to dinner and a show after. And forget starting an online business or finding someone to host it.
Today, your business, banking, shopping, and chat with your friends are all readily handled from your tablet or phone. If you’re not in the mood for a fancy outing, Netflix and a quick Internet-ordered pizza take care of the evening’s entertainment needs—and all of it can be accomplished in less time than it takes to say “The Internet made me a hermit.“
Despite having existed for far less time than inventions such as the automobile or television, the Internet towers over them when it comes to reaching record-breaking numbers of people. It took the automobile nearly 130 years to break a billion units, and even after 95 years of a more-or-less constant love affair with television, today’s world has just under 1.5 billion television sets.
Planned obsolescence and technological evolution notwithstanding, those numbers remain surprising when compared to the Web usage of 2.7 billion folks who use the Internet every single day (many of them for at least three hours at a time and on a variety of devices). And by 2020, says at least one leading technology expert, literally everyone will be online. Whether this prediction is accurate or merely a flight of fancy, one thing is certain: it’s an issue that will no doubt receive lots of attention—on the Internet.
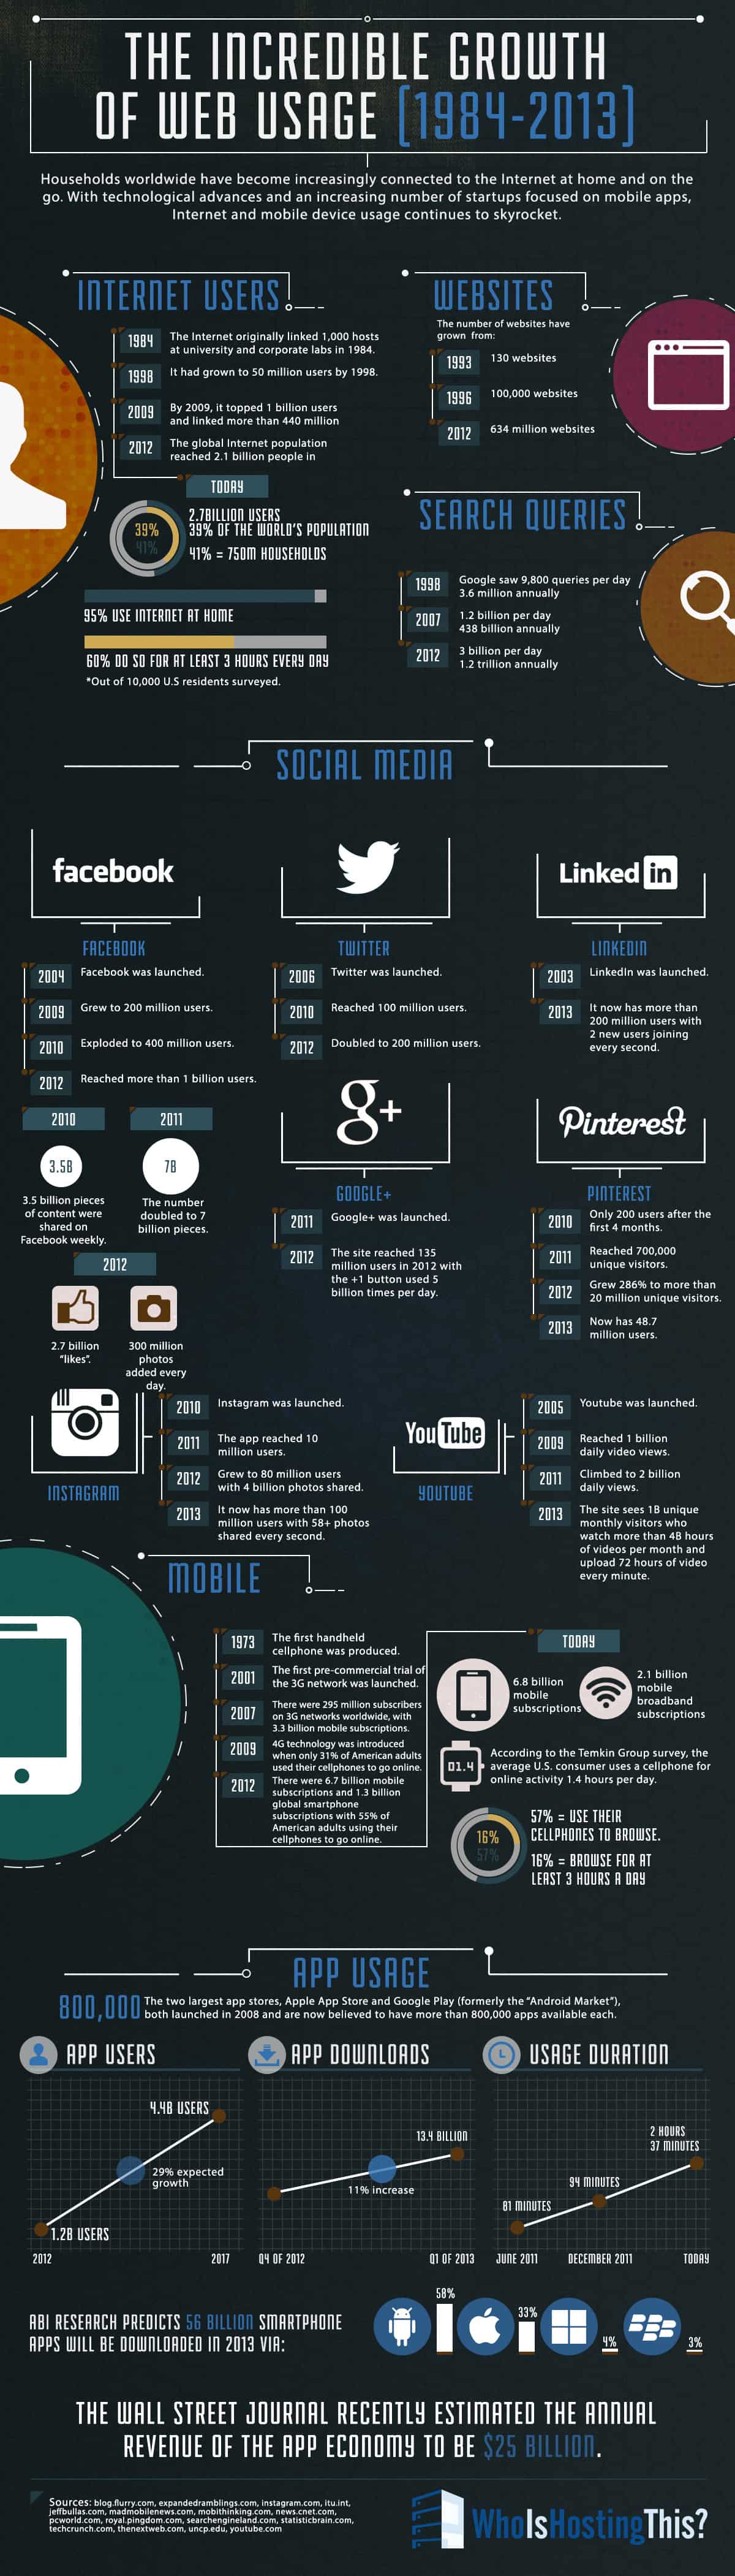
The Incredible Growth of Web Usage (1984-2013)
Households worldwide have become increasingly connected to the Internet at home and on the go. With technological advances and an increasing number of startups focused on mobile apps, Internet and mobile device usage continues to skyrocket.
Internet Users
- 1984: The Internet originally linked 1,000 hosts at university and corporate labs in 1984.
- 1998: It had grown to 50 million users by 1998.
- 2009: By 2009, it topped 1 billion users and linked more than 440 million.
- 2012: The global Internet population reached 2.1 billion people.
- Today: 2.7 billion users, 39% of the world’s population which is 750 million households.
- 95% use Internet at home
- 60% do so for at least 3 hours every day
Websites
The number of websites have grown from:
- 1993: 130 websites
- 1996: 100,000 websites
- 2012: 634 million websites
Search Queries
- 1998: Google saw 9,800 queries per day, 3.6 million annually
- 2007: 2.7 billion per day, 438 billion annually
- 2012: 3 billion per day, 1.2 trillion annually
Social Media
- 2004: Facebook was launched.
- 2009: Grew to 200 million users.
- 2010: Exploded to 400 million users.
- 2012: Reached more than 1 billion users.
- 2010: 3.5 billion pieces of content were shared on Facebook weekly.
- 2011: 7 billion – the number doubled to 7 billion pieces shared weekly.
- 2012: 2.7 billion “likes” and 300 million photos added every day.
- 2006: Twitter was launched.
- 2010: Reached 100 million users.
- 2012: Doubled to 200 million users.
- 2003: LinkedIn was launched.
- 2013: It now has more than 200 million users with 2 new users joining every second.
Google+
- 2011: Google+ was launched.
- 2012: The site reached 135 million users in 2012 with the +1 button used 5 billion times per day.
- 2010: Only 200 users after the first 4 months.
- 2011: Reached 700,000 unique visitors.
- Grew 286% to more than 20 million unique visitors.
- 2013: Now has 48.7 million users.
- 2010: Instagram was launched.
- 2011: The app reached 10 million users.
- 2012: Grew to 80 million users with 4 billion photos shared.
- 2013: It now has more than 100 million users with 58+ photos shared every second.
YouTube
- 2005: YouTube was launched.
- 2009: Reached 1 billion daily video views.
- 2011: Climbed to 2 billion daily views.
- 2013: The site sees 1B unique monthly visitors who watch more than 4B hours of videos per month and upload 72 hours of video every minute.
Mobile
- 1973: The first handheld cellphone was produced.
- 2001: The first pre-commercial trial of the 3G network was launched.
- 2007: There were 295 million subscribers on 3G networks worldwide, with 3.3 billion mobile subscriptions.
- 2009: 4G technology was introduced when only 31% of American adults used their cellphones to go online.
- 2012: There were 6.7 billion mobile subscriptions and 1.3 billion global smartphone subscriptions with 55% of American adults using their cellphones to go online.
App Usage
The two largest app stores, Apple App Store and Google Play (formerly the “Android Market”), both launched in 2008 and are now believed to have more than 800,000 apps available each.
App Users
- 2012: 1.2B users
- 29% expected growth (1.5B)
- 2012: 4.4B users
- 266% increase
App Downloads
- Q1 of 2013: 13.4 billion downloads
Usage Duration
- June 2011: 81 minutes
- December 2011: 94 minutes
- Today: 2 hours and 37 minutes
ABI Research predicts 56 billion smartphone apps will be downloaded in 2013 via:
- Android – 58%
- Apple – 33%
- Windows – 4%
- BlackBerry – 3%
The Wall Street Journal recently estimated the annual revenue of the app economy to be $25 billion.


The Incredible Growth of Web Usage between: 1984-2013 (Infographic) – Hot in Social Media – Hot in Social Media
August 29, 2013
[…] guys from Who is Hosting This made an interesting Infographic about this Incredible Growth of Web Usage in the last 30 years, […]